Phil Erlanger Research Co.
Erlanger Technical Rank
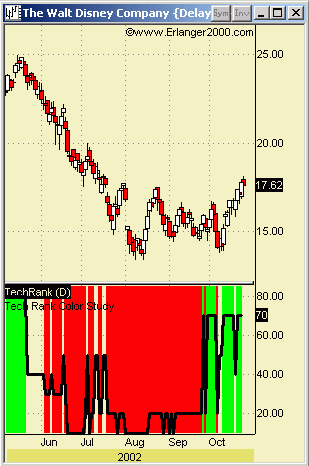
The Erlanger Technical Rank is a proprietary statistic and it ranges from 10% to 100%. It is a nonlinear modeling of each issue's strength relative to the S&P 500. Many years ago, we used advanced computational pattern recognition methods to allow the computer to interpret relative strength patterns in the same way a technical analyst would. We were able to do this enabling the computer to score relative strength patterns on thousands of stocks at a moment's notice. Each issue's relative strength pattern falls into one of ten distinct patterns. A higher Erlanger Technical Rank means that there is a stronger pattern of relative strength.
Range 1 to 100
- Bullish >= 60
- Bearish <= 30